Pie & Donut Chart PowerPoint Templates To Download
Pie Chart With Social Media Market Share PowerPoint & Keynote Template
A pie chart with social media PowerPoint is used to display statistical data for planning & functioning of a business or organization. Also, it is useful to show marketing plans & strategies, sales & revenue etc. Moreover, user can do the changes in the templates according to their need.
Business Opportunity PowerPoint Pie-Chart Template
Basically, it is used to create a graphical demonstration of statistical data. It has an infographic icon & a cluster bar chart. It can be used as a valuable statistical tool for report analysis. Otherwise, the user can also use it as a normal circular diagram with rotation.
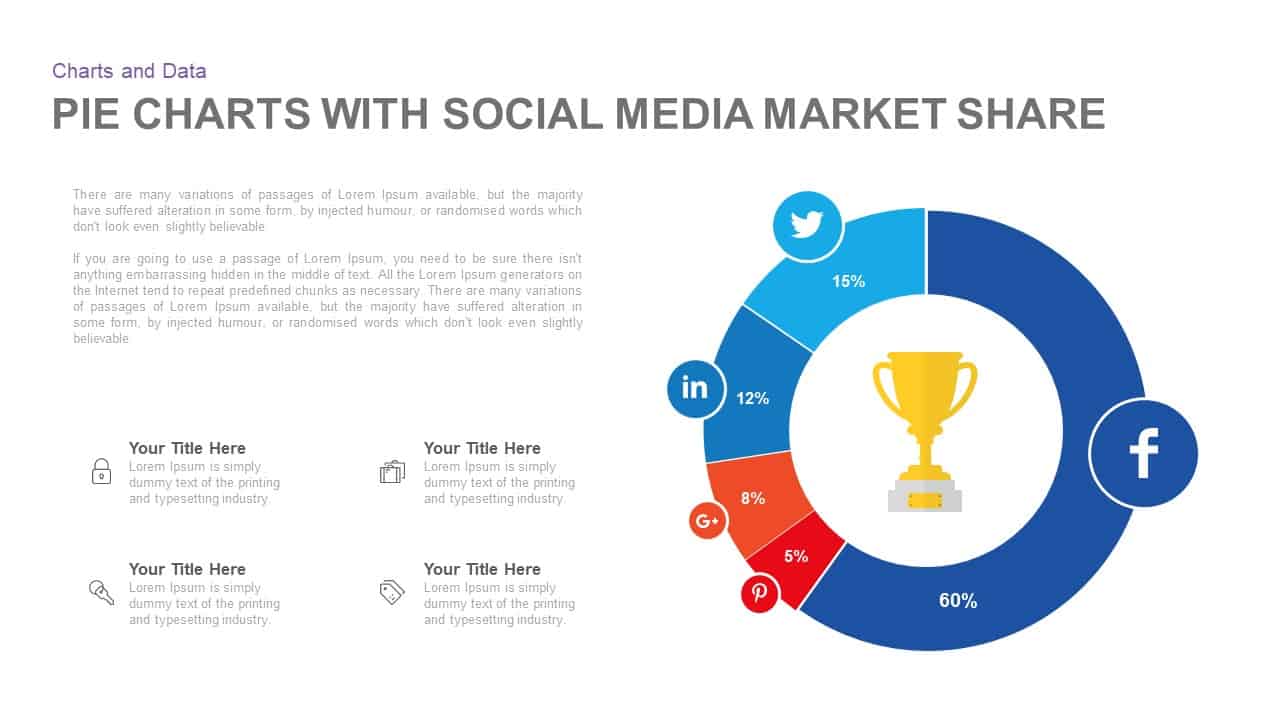
Donut Chart Performance PowerPoint Template & Keynote Slide
Designed for both PowerPoint & keynote in widescreen(16:9) & normal(4:3). Donut Chart Performance PowerPoint Template & Keynote Slide display the percentage of the element’s performance. User can modify the effects of this fully editable template & slide. A trophy at the middle symbolizes the goal-orientation mode of presentation.
Multi-level Donut Chart Template for PowerPoint & Keynote
It has two slides that can be used to show the percentage & values. It can be used to illustrate the functionality of complex data settings. A user can deliver his/her sales report by using this multi-level donut chart. It is available in two backgrounds & four different text areas. Moreover, a presenter can edit the amazing clipart as per their data.
Circular Chart Infographic PowerPoint Template & Keynote
Circular Chart Infographic has four different half circles with various sizes & colour. It can also be used to present the demographic distribution of a country. A presenter can do the overall changes in the template structure according to his/her need. Also, it is easy to download & use.
You can download more Pie & Donut Chart PowerPoint Templates from Slidebazaar. Visit us & explore more templates to make your presentation effective.


Comments
Post a Comment